TNKM Quickstart: 1D Regression with CPKM
This quickstart shows how to:
- Generate a synthetic nonlinear regression dataset.
- Train a
CPKMmodel with polynomial features. - Evaluate and visualize predictions.
# Imports and numeric setup
import jax
import jax.numpy as jnp
import matplotlib.pyplot as plt

from tnkm.models import CPKM
from tnkm.optim import train_als
from tnkm.features import ProductFeatures, PolyFeature

jax.config.update("jax_enable_x64", True)
plt.style.use("seaborn-v0_8-whitegrid")
Generate Dataset
def make_synthetic_data(
    n_samples: int = 100,
    noise: float = 0.1,
    seed: int = 0
) -> tuple:
    """Generate a simple nonlinear regression dataset."""
    key_x, key_n = jax.random.split(jax.random.PRNGKey(seed))
    x = jnp.sort(
        jax.random.uniform(
            key_x, (n_samples, 1), minval=-3.0, maxval=3.0
        ),
        axis=0,
    )
    y_true = jnp.sin(x) + 0.3 * x**2
    y = y_true + noise * jax.random.normal(key_n, y_true.shape)
    return x, y, y_true

x_train, y_train, y_train_true = make_synthetic_data(100, seed=0)
x_test, y_test, y_test_true = make_synthetic_data(100, seed=1)

# Normalize using training statistics (important: avoid test leakage)
eps = 1e-8

# Input normalization
x_min, x_max = x_train.min(0), x_train.max(0)
x_train = (x_train - x_min) / (x_max - x_min + eps)
x_test  = (x_test  - x_min) / (x_max - x_min + eps)

# Output normalization
y_mean, y_std = y_train.mean(), y_train.std()
y_train = (y_train - y_mean) / (y_std + eps)
y_test  = (y_test  - y_mean) / (y_std + eps)

# Flatten for models
x_train, y_train = x_train.squeeze(), y_train.squeeze()
x_test, y_test  = x_test.squeeze(), y_test.squeeze()
Define and Train the CPKM Model
# Feature map + Model
features = ProductFeatures(PolyFeature(26), d_dim=1)
model = CPKM(features, rank=4, seed=0)

# Train
train_als(
    model,
    x_train,
    y_train,
    n_epoch=10,
    gamma_w=1e-5,
    beta_e=1.0
)

# Predict
y_pred = model.predict(x_train)
y_test_pred = model.predict(x_test)

# Metrics
train_mse = jnp.mean((y_pred - y_train) ** 2)
test_mse = jnp.mean((y_test_pred - y_test) ** 2)

print(f"Train MSE: {float(train_mse):.6f}")
print(f"Test  MSE: {float(test_mse):.6f}")
Train MSE: 0.005788
Test  MSE: 0.009058
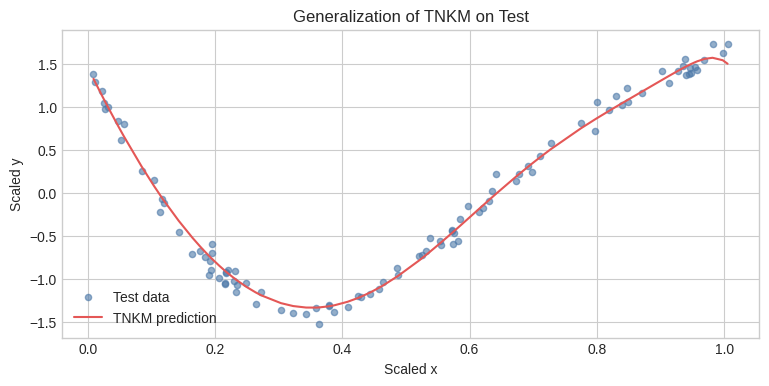
order = jnp.argsort(x_test)
plt.figure(figsize=(9, 4))
plt.scatter(x_test, y_test, s=20, alpha=0.6, label="Test data", color="#4C78A8")
plt.plot(x_test[order], y_test_pred[order], label="TNKM prediction", color="#E45756")

plt.title("Generalization of TNKM on Test")
plt.xlabel("Scaled x")
plt.ylabel("Scaled y")
plt.legend()
plt.show()
Next steps
Experiment with the model:
- Increase
rankto improve expressivity - Change
PolyFeaturedegree to adjust nonlinearity - Train longer with
n_epoch - Adjust
gamma_wto control regularization strength - Plug in your own dataset instead of synthetic data